Unlock a world of possibilities! Login now and discover the exclusive benefits awaiting you.
- Qlik Community
- :
- Forums
- :
- Analytics
- :
- QlikView
- :
- Documents
- :
- Files for creation of a Gantt chart
- Subscribe to RSS Feed
- Mark as New
- Mark as Read
- Bookmark
- Subscribe
- Printer Friendly Page
- Report Inappropriate Content
Files for creation of a Gantt chart
- Mark as New
- Bookmark
- Subscribe
- Mute
- Subscribe to RSS Feed
- Permalink
- Report Inappropriate Content
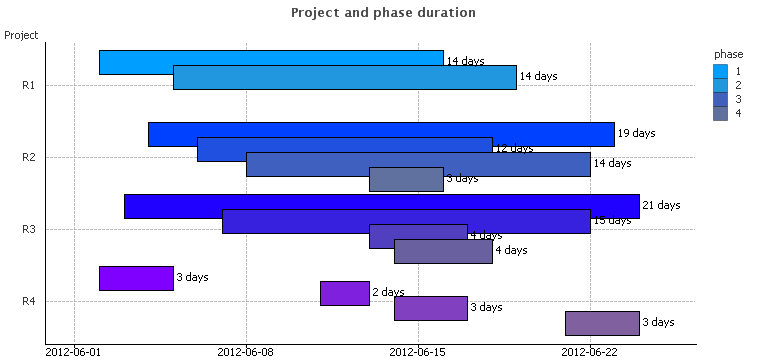
Files for creation of a Gantt chart
Have you ever wanted to create a Gantt chart in QlikView, only to find out that this chart type is not one of the pre-defined charts? Then you should be happy to learn that it is possible to create a Gantt chart and that it is not very difficult. See more on Recipe for Gantt chart.
- Mark as Read
- Mark as New
- Bookmark
- Permalink
- Report Inappropriate Content
I can´t open the document, getting the following error message:
„The license that is embedded in this document is not valid“
- Mark as Read
- Mark as New
- Bookmark
- Permalink
- Report Inappropriate Content
Fixed!
HIC /2013-03-08
- Mark as Read
- Mark as New
- Bookmark
- Permalink
- Report Inappropriate Content
It seems great!... Good job!
- Mark as Read
- Mark as New
- Bookmark
- Permalink
- Report Inappropriate Content
Hi Henric very nice chart, I did something similar a few weeks ago. It is sure not of that quality like yours 
Pop-Up for Duration shows a strange values? ...
I have some questions:
1. Is it possible to "name"(# of days) the "wasted" time ( the gaps)? I could only solve this with an additional line in the table for every gap, which is obviously pretty "unclean"(from a data view).
2. Is it possible to create a vertical line at the actual date? So that the users can immediatly see what is forecast/planned and past/actual? Or some "blurr" effects for forecast data(like a curtain, sry don't know the right word). Actual Date could be replaced by $anydate or a specific flag like "isforecast" ... perhaps 
I know very much demands like always Sorry for that, but I think this would be a great chart if it works.
By the way I used this for visualizing processes in production environment...not sales or projects
Thank you for your great work...
- Mark as Read
- Mark as New
- Bookmark
- Permalink
- Report Inappropriate Content
If you want to name the gaps, you need to have them in a table. But you could in principle have two tables, one with the original intervals, and a second with the sub-intervals. Then the gaps would exist in the subinterval table only, while all calculations are made on the original intervals. That would be a clean solution.
See more in IntervalMatch and Slowly Changing Dimensions about splitting up intervals in subintervals.
A vertical line? Just use a reference line (on the Presentation tab).
HIC
- Mark as Read
- Mark as New
- Bookmark
- Permalink
- Report Inappropriate Content
Hi Henric,
thank you for your Feedback.
I will have a look at the linked article and try that.
But I don't get the reference line to work, at a specific date like today(2). Do you have a hint on that?
- Mark as Read
- Mark as New
- Bookmark
- Permalink
- Report Inappropriate Content
The reference lines should work. See picture below. (I use -440 since the data is one year and three months old.)
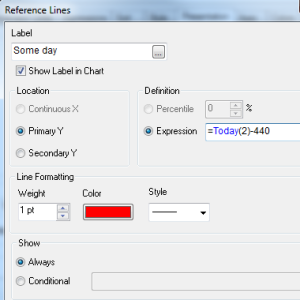
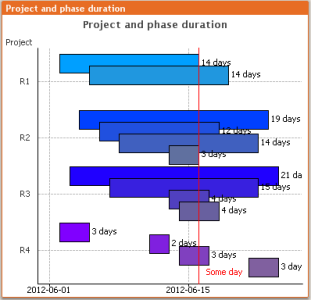
Further, I realized that what I wrote in the white paper is only applicable if the intervals are used as dimension. Here, the intervals are missing areas in the expression. Hence, the white paper is not applicable.
HIC
- Mark as Read
- Mark as New
- Bookmark
- Permalink
- Report Inappropriate Content
OK. I created it without intervalls, but I will check out a solution with your above example(s).
The reference line: I tried it the same way, but I think it's then just a formatting issue of the datefield because I use FP (financial period) instead of month...
- Mark as Read
- Mark as New
- Bookmark
- Permalink
- Report Inappropriate Content
Henric, may I ask for something more within the Gantt vizualization ?
I wish for... a dotted line (with arrow) to connect the End to the next Start within each dependency. I am dreaming about it for quite a while after doing things similar to your sample QVW... 😉
Thanks a lot
- Mark as Read
- Mark as New
- Bookmark
- Permalink
- Report Inappropriate Content
Hi Henric and others!
I am trying to create this type of Gantt chart and it is working ok in grouped but when I try to stack the bars only one event is showing, the others disappear. Any idea why this happens and how I can fix it?
Regards,
Heidi