Unlock a world of possibilities! Login now and discover the exclusive benefits awaiting you.
This space offers a variety of blogs, all written by Qlik employees. Product and non product related.
Product Innovation
By reading the Product Innovation blog, you will learn about what's new across all of the products in our growing Qlik product portfolio.
Support Updates
The Support Updates blog delivers important and useful Qlik Support information about end-of-product support, new service releases, and general support topics.
Qlik Academic Program
This blog was created for professors and students using Qlik within academia.
Community News
Hear it from your Community Managers! The Community News blog provides updates about the Qlik Community Platform and other news and important announcements.
Qlik Digest
The Qlik Digest is your essential monthly low-down of the need-to-know product updates, events, and resources from Qlik.
Qlik Education
The Qlik Education blog provides information about the latest updates of our courses and programs with the Qlik Education team.
Recent Blog Posts
-
Recipe for a 4-4-5 Calendar
Calendars are used in most Qlik apps. In most cases, a standard Gregorian calendar is used, but in some cases a more complex calendar is needed. This post is about how to create a week-based fiscal calendar of a 4-4-5 type.
-
Connector Factory – April 2024 releases
This month, Connector Factory has released more connectors for data integration, data analytics and application automation. -
Creating Visual Button Selections States
Ever wonder how those Qlik experts make those awesome interactive dashboards? It is easier than you think. Check out this video that quickly shows you how to create custom beautiful buttons to apply selections and visually represent an active or non-active selection state. Allowing users just another way to analyze data in a way that is easy and familiar.
-
Creating a Collapsible Filter Panel
This video will show you how easy it is to create a collapsible filter panel that is both functional and inclusive to your dashboard objects.
-
Updates to Qlik Cloud Security Roles
On April 16th, 2024, Qlik is launching a highly anticipated capability: custom security roles. What do custom security roles do? Custom security roles introduce fine control of data export and access permissions within Qlik apps. This allows you to tailor permissions to your specific needs, enhancing data security and compliance. The first delivery on April 16th includes the capability to control who can export content. Additional capabilities wi... Show MoreOn April 16th, 2024, Qlik is launching a highly anticipated capability: custom security roles.
What do custom security roles do?
Custom security roles introduce fine control of data export and access permissions within Qlik apps. This allows you to tailor permissions to your specific needs, enhancing data security and compliance.
The first delivery on April 16th includes the capability to control who can export content. Additional capabilities will be added soon after, such as who can create data connections, reports, and similar.
What does this mean for me?
As part of this update, the existing "has restricted view" space role will gain the ability to export data to Excel. This adjustment is in line with Qlik's capacity-based pricing model, ensuring basic users have essential tools.
If you do not wish for users with the "has restricted view" space role to be able to export data, you will need to create a custom role on the release date to maintain the desired restrictions.
Stay tuned for more information and resources leading up to the April 16th launch. We are excited about these enhancements and the value they will bring to your data management and security efforts within Qlik.
Thank you for choosing Qlik,
Qlik Support -
QlikView - New Security Patches Available Now
Update 21st of March 16:00 CET: published CVE numberUpdate 27th of March 10:45 CET: added FAQ Hello Qlik Users, A security issue in QlikView has been identified and patches have been made available. Details can be found in the Security Bulletin High Severity Security fix for QlikView (CVE-2024-29863). Today, 20th of March 2024, we have released two service releases across the latest versions of QlikView to patch the reported issue. All versions o... Show MoreUpdate 21st of March 16:00 CET: published CVE number
Update 27th of March 10:45 CET: added FAQHello Qlik Users,
A security issue in QlikView has been identified and patches have been made available. Details can be found in the Security Bulletin High Severity Security fix for QlikView (CVE-2024-29863).
Today, 20th of March 2024, we have released two service releases across the latest versions of QlikView to patch the reported issue. All versions of QlikView prior to and including the releases below are impacted:
- QlikView May 2023 SR1 (12.80.20100)
- QlikView May 2022 SR2 (12.70.20200)
Call to Action
As no workarounds can be provided, Customers should upgrade QlikView to one of the following versions that contain the fix:
- QlikView May 2023 SR2 (12.80.20200)
- QlikView May 2022 SR3 (12.70.20300)
This issue only impacts QlikView. Other Qlik data analytics products including Qlik Cloud and Qlik Sense Enterprise on Windows are not impacted.
Additional Details
- All Qlik software can be downloaded from our official Qlik Download page (customer login required). Follow best practices when upgrading QlikView.
- Qlik provides patches for major releases until the next Initial or Service Release is generally available. See Release Management Policy for Qlik Software.
- Notwithstanding, additional patches for earlier releases may be made available at Qlik’s discretion.
- The information in this post and Security Bulletin High Severity Security fix for QlikView (CVE-2024-29863) is disclosed in accordance with our published Security and Vulnerability Policy.
The Security Notice label is used to notify customers about security patches and upgrades that require a customer’s action. Please subscribe to the ‘Security Notice’ label to be notified of future updates.Frequently Asked Questions
Q: Is the vulnerability present in the QlikView Plugin or other QlikView products?
A: The vulnerability is related to the MSI files on disk.Q: Will deleting the MSI files mitigate the issue?
A: Qlik does not consider removing the MSI files a complete workaround. A server user can restore them. -
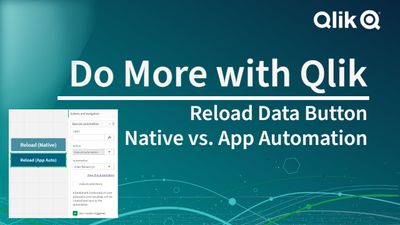
Button + Reload Data or Button + Execute App Automation - which do I use?
Learn the differences between Qlik Sense button actions - Reload Data and Execute Automation - when you want to reload a Qlik Sense app, or have ANY user execute an automation.
-
New Set Analysis syntax
Set analysis is one of the more powerful tools you can use in Qlik Sense and QlikView. Its syntax is sometimes perceived as complicated, but once you learn it, you can achieve fantastic things. There is now an additional way of writing the Set expression, that may simplify your code.
-
Entitlement Analyzer for Qlik Sense Enterprise SaaS (Cloud only)
We are happy to share with you the new Entitlement Analyzer for Qlik Sense Enterprise SaaS! This application will enable you to answer questions like: How can I track the usage of my Tenant over time? How are my entitled users using the Tenant? How can I better understand the usage of Analyzer Capacity vs. Analyzer & Professional Entitlements? The Entitlement Analyzer app provides insights on: Entitlement usage overview across the Tenant ... Show MoreWe are happy to share with you the new Entitlement Analyzer for Qlik Sense Enterprise SaaS! This application will enable you to answer questions like:
- How can I track the usage of my Tenant over time? How are my entitled users using the Tenant?
- How can I better understand the usage of Analyzer Capacity vs. Analyzer & Professional Entitlements?
The Entitlement Analyzer app provides insights on:
- Entitlement usage overview across the Tenant
- Analyzer Capacity – Detailed usage data and a predication if you have enough
- How users are using the system and if they have the right Entitlement assigned to them
- Which Apps are used the most by using the NEW "App consumption overview" sheet
- And much more!
The Entitlement Analyzer uses a new API Endpoint to fetch all the required data and will store the history in QVD files to enable even better Analytics over time.
A few things to note:
- This app is provided as-is and is not supported by Qlik Support.
- It is recommended to always use the latest app.
- Information is not collected by Qlik when using this app.
The app as well as the configuration guide are available via GitHub, linked below.
- QVF: https://github.com/qlik-oss/qlik-cloud-entitlement-analyzer/releases/latest/download/entitlement-analyzer.qvf
- Release Notes: https://github.com/qlik-oss/qlik-cloud-entitlement-analyzer/releases/latest
- Installation Guide: https://github.com/qlik-oss/qlik-cloud-monitoring-apps/releases/latest/download/qlik-cloud-monitorin...
Any issues, questions, and enhancement requests should be opened on the Issues page within the app’s GitHub repository.
Be sure to subscribe to the Qlik Support Updates Blog by clicking the green Subscribe button to stay up to date with the latest Qlik Support announcements. Please give this post a like if you found it helpful!
Kind regards,
Qlik Platform Architects
Additional Resources:
Our other monitoring apps for Qlik Cloud can be found below.
- App Analyzer
- Reload Analyzer
- Access Evaluator
- OEM Dashboard (for OEM Partners and multi-cloud tenants)
-
Welcome back Javier Leon - Qlik Educator Ambassador for 2024!
We feel very lucky to have Javier Leon back as an Academic Program Educator Ambassador for a fourth year. -
Traffic Accidents in Brazil
Traffic Accidents in Brazil Hyperscale This dashboard was developed with the aim of studying the new layout Container and design possibilities it offers. The data used originated from a survey of accidents on federal highways in Brazil. Discoveries Types of accidents most common on Brazilian highways, which highways are the most dangerous and require an action plan to reduce accidents, the times and days with the highest occurrence of... Show MoreTraffic Accidents in BrazilHyperscale This dashboard was developed with the aim of studying the new layout Container and design possibilities it offers. The data used originated from a survey of accidents on federal highways in Brazil.
Discoveries
Types of accidents most common on Brazilian highways, which highways are the most dangerous and require an action plan to reduce accidents, the times and days with the highest occurrence of accidents.
Impact
Mapping the most dangerous highways for a future action plan to reduce accidents, monitoring the most critical times on the roads.
Audience
Traffic enforcement agencies, municipalities, and states
Data and advanced analytics
Ease of visibility of Brazilian highways and comparison between states and highways.
-
Qlik Analytics connectors: Twitter connector to be updated
Update April 18th 2024: As of April 2024, the Twitter Connector will be permanently removed from Qlik Sense SaaS. The removal from Qlik Sense client-managed is scheduled for the August 2024 release, and the removal from the standalone Qlik Web Connector is targeted for fall 2024. There are currently no plans to introduce a new Twitter Connector, although this was previously the intention. Twitter has changed the structure for the available API ac... Show MoreUpdate April 18th 2024: As of April 2024, the Twitter Connector will be permanently removed from Qlik Sense SaaS. The removal from Qlik Sense client-managed is scheduled for the August 2024 release, and the removal from the standalone Qlik Web Connector is targeted for fall 2024.
There are currently no plans to introduce a new Twitter Connector, although this was previously the intention.Twitter has changed the structure for the available API access levels and removed broader access to analytics via Twitter API v1.1. Due to this change, the Qlik Sense connector for Twitter has recently stopped working. The Twitter API v2 is now required, but the current Qlik connector only supports API v1.1.
Additionally, Qlik has managed a common Twitter App for all users’ authentications, which with this change can no longer be used to support the requests made via the connector.
Qlik will introduce a new connector against the Twitter API v2. This new connector will support customer-managed Twitter Apps, allowing you to acquire the API access level specific to your needs and access the analytics data with your own account. Consequently, there will be no API access provided by Qlik.
Unfortunately, this means that the current connector for Twitter will be deprecated, and it will be removed from Qlik Cloud Analytics. It will also be removed from Qlik Sense Enterprise on Windows in the August 2023 release and the standalone Qlik Web Connectors package in December 2023.
You can find detailed information about the Twitter access levels and versions in the Getting started page in the Twitter developer portal. There is also a Step-by-step guide to making your first request to the new Twitter API v2, which explains how to manage and create a Project and connect an App within your Twitter account.
Thanks for choosing Qlik!
Qlik Global Support -
Welcome back Angelika Klidas - Qlik Educator Ambassador Class of 2024!
This week we would like to introduce Angelika Klidas, who happens to be a returning Educator Ambassador. We are excited to select Angelika as an Ambassador for the 3rd year in a row due to her continued enthusiasm for Qlik’s Academic Program and her efforts in 2023. Angelika’s journey with Qlik began in 2008 when she started out installing and managing a successful QlikView Competence Center as a team manager of the team for a Governmental Organ... Show MoreThis week we would like to introduce Angelika Klidas, who happens to be a returning Educator Ambassador. We are excited to select Angelika as an Ambassador for the 3rd year in a row due to her continued enthusiasm for Qlik’s Academic Program and her efforts in 2023.
Angelika’s journey with Qlik began in 2008 when she started out installing and managing a successful QlikView Competence Center as a team manager of the team for a Governmental Organization in the Netherlands. Since then, she has always been a huge Qlik Advocate in both her day job and her university teaching. Angelika works currently as an Advisor & Trainer and the Business Data Challengers and is responsible for the BDC Academy, sales and account management along with some innovative work! She also teaches Data and Analytics at the University of Applied Sciences in Amsterdam which is her part time role. She is a conceptual thinker who lives by the phrase “think big, act small, and scale fast” which she uses to inspire others to evolve in their use of data and analytics.
In 2022, Angelika began writing a book together with Qlik’s Chief Learning Officer Kevin Hanegan about Data Literacy. The book was formally launched on the 30th of November 2022 and is called “Data Literacy in Practice”. The book is available through Amazon.com and Packt.com.
Angelika applied to become a Educator Ambassador with the Qlik Academic Program as she is passionate about educating students in data analytics and championing the cause of Data & AI Literacy. Due to the change in situation in the field of education, she included new aspects in her teaching style which include setting up training materials “how to use Qlik Sense from an analysis perspective so that students know and understand the full power of Qlik Sense, using AHA Slides (to make the lectures more interactive) and the book “Data Literacy in Practice”. Her book is now also a mandatory book for the University. With the help of the techniques from the book and learning to work with Qlik Sense helps her students not only to analyze the data in a better manner but also how to help organizations form a data strategy, develop organizational KPI’s and build amazing dashboards & reports.
Angelika is proud of the fact that she is the Qlik Academic Program Ambassador and has included the Educator Ambassador badge, mentioned it on her resume and highlights it in her presentations! This year again she is presenting twice at Qlik Connect and is also a Panelist for around the topic ethical handling of data.
In Angelika’s words, “I love the power of grey, love the academic program and the great benefit that it gives to me and my students. My students can pursue their dreams when they would like to work in data and analytics .” She is excited about the fact that some of her students got a job in the data and analytics world, which is amazing! An interesting fact is that since 2008, 34% of her 295 students are working in the field of data and analytics. Her main goal for 2024 is to work on new training materials for Data & AI Literacy in Dutch and English. Angelika has developed several Generative AI trainings that help people (at school and in her commercial work field) to use the Gen AI tools, but also she trains them to question the outcome. Questioning the results, either from insights that we create or the results that we get from the Gen AI tools we use is mega important. Next to that Angelika has developed a “Serious Data Training” where she combines a the first basic concepts of Data & AI Literacy, a Data Escape Room and a session of reflecting on the soft skills that people need during the process of data informed decisions.
Angelika feels that more and more organizations are now emphasizing the importance of Data & AI Literacy. She loves to work with the four pillar system which should be the basis of every organizations journey towards “Active Intelligence” so they will be future ready!
In Angelika’s words, “I love the Qlik Academic Program, it helps the students in gaining analytics knowledge for my students. They can learn at their own pace and look for solutions through the learning platform, but also use the knowledge from the community and demos.qlik.com where they can find all kinds of cool solutions”
We are looking forward to working closely with Angelika during her tenure as an ambassador yet again and creating more links with Universities in the Netherlands.
For more information about our Ambassador Program, please visit: qlik.com/us/company/academic-program/ambassadors
-
The new Qlik Google Analytics 4 (GA4) Connector
Google's Universal Analytics will stop processing new hits on July 1st 2023 and makes room for Google Analytics 4. Continue loading your data using Qlik's new GA4 connector, available for Qlik Cloud and Qlik Sense Enterprise on Windows as of today: Google Analytics 4 (Cloud) | Google Analytics 4 (on-premise) The new Google Analytics 4 connector is also included in the Qlik Web Connector Standalone package: Google Analytics 4 (standalone) Relat... Show MoreGoogle's Universal Analytics will stop processing new hits on July 1st 2023 and makes room for Google Analytics 4.
Continue loading your data using Qlik's new GA4 connector, available for Qlik Cloud and Qlik Sense Enterprise on Windows as of today: Google Analytics 4 (Cloud) | Google Analytics 4 (on-premise)
The new Google Analytics 4 connector is also included in the Qlik Web Connector Standalone package: Google Analytics 4 (standalone)
Related Content and Relevant Sources:
[GA4] Introducing the next generation of Analytics, Google Analytics 4 | support.google
Prepare for the future with Google Analytics 4 | blog.google -
Complete your Qlik Nation challenges in Qlik Community
Introducing an easy way for you to engage, earn points and rank up. -
Watch Q&A with Qlik: Qlik Sense Enterprise Migration!
Don't miss our previous Q&A with Qlik! Hear from our panel of experts to help you get the most out of your Qlik experience. SEE THE RECORDING HERE
-
New Helpful Features
In this blog post, I will cover four Qlik Cloud features that you may not be aware of, but I find to be useful. They are: New navigation option for buttons. The ability to change the opacity of a background color. The ability to add links to straight and pivot tables. Placement of sheet navigation buttons with hidden sheet header. The first feature is the option to navigate to a specific chart using button actions and navigation. We have always... Show MoreIn this blog post, I will cover four Qlik Cloud features that you may not be aware of, but I find to be useful. They are:
- New navigation option for buttons.
- The ability to change the opacity of a background color.
- The ability to add links to straight and pivot tables.
- Placement of sheet navigation buttons with hidden sheet header.
The first feature is the option to navigate to a specific chart using button actions and navigation. We have always had the ability to navigate to a specified sheet but now, we can select a chart to highlight. In the Sales Analysis sheet below, there is a View Sales Details button on the bottom left that is used to navigate the user to the Details sheet and highlight the Sales Details table.
To implement this, the actions and navigation properties of the button need to be set to the Details sheet and the chart ID for the Details table, as seen below.
The Chart ID drop down will show all the IDs for charts on the selected sheet. (In this case, the Details sheet). To ensure you are selecting the correct chart, you can check or copy the chart ID by right clicking on the chart, clicking on …, selecting Share from the menu, then selecting Embed from the menu. These steps are illustrated below.
The Embed dialog window below will open and beneath the chart is its object ID. You can copy the object ID and paste it in the properties window for the button or note it and select it from the chart ID drop down list.
In this example, I used the “go to chart” to navigate between sheets but it can also be used on a single sheet. Now, when the user clicks on the View Sales Details button, they are navigated to the Details sheet and the Sales Details table, at the top of the sheet, is highlighted. Notice the blue colored box around it.
The second new feature is the ability to change the opacity of the background color. In the chart below, I have added a background color in the styling properties of the chart. After I select a color for the background, I can use the slider to adjust the opacity, if I choose. In this example, I set it to 60%. By default, it will set to 100% opacity.
The third new feature is the ability to add links to straight tables and pivot tables. Both tables are found in the Visualization bundle.
To add the link is easy. In the properties of the column (see image below), the Field should be the URL you would like for the link. In this example, the link is hard-coded, but you can also use a field value or expression to generate the link. The key to this working is setting Representation to Link (versus Text, which is the default).
The fourth, and last, new feature that I am going to cover in this blog is the new placement of the sheet navigation arrows when the sheet header is hidden. In a previous blog, I discussed how to toggle the sheet header and sheet toolbar. The sheet navigation arrows are in the sheet header as seen below and in the past when the sheet header was hidden, the navigation arrows were not available.
Now, when the sheet header is hidden, the sheet navigation arrows are moved up to the sheet toolbar. A small change, but quite helpful.
Now if you opt to hide the sheet toolbar as well, you may want to consider adding navigation to your sheet.
To wrap it up, this blog covers some small new features that you may find helpful. Users can now navigate to a visualization via button actions, the styling properties have been improved with the ability to set the opacity for a background color, URL links are available in straight and pivot tables and sheet navigation has become a little more flexible. Check out these new features next time you are developing an app.
Thanks,
Jennell
-
Checkout the New Pivot Table!
Unlock the power of data with our new, redesigned Pivot Table available in the Visualization Bundle.
-
Social networks analysis
Social networks analysisActium DigitalThis application is used Instagram, Twitter and Google analytics. Folowers, posts and visits.DiscoveriesYou can analyze visits to your web, views to you instagram profileImpactYou can review impact on your posts.AudienceMarketing peopleData and advanced analyticsYou can check most visited pages on your web -
Reporting Service Packaging Changes
Qlik Cloud Reporting packaging changes are here! We’ll be replacing the multiple tiers with simple ‘Small and Large Add-On Packs’, alongside standardized limits for easier management. Our new Standard, Premium and Enterprise customers using our Capacity Model, will have reporting entitlements included in their package. Customers on our User Based Model will have 1000 reports included and available to them. All customers can purchase our add-on p... Show MoreQlik Cloud Reporting packaging changes are here!
We’ll be replacing the multiple tiers with simple ‘Small and Large Add-On Packs’, alongside standardized limits for easier management.
Our new Standard, Premium and Enterprise customers using our Capacity Model, will have reporting entitlements included in their package. Customers on our User Based Model will have 1000 reports included and available to them.
All customers can purchase our add-on packages when needed.
See structure below:
Key: QSE = Qlik Sense Enterprise / QCA = Qlik Cloud Analytics
Items to Note:- Depending on your product package, you will be automatically placed in the standardized limits above. Those who already have paid tiers will continue-on their current tier until their contract ends.
- If you’re expecting to exceed your standard limit, be sure to contact sales to purchase our add-on packages to prevent future overages.
Additional Resources:Reporting Services | Product Innovation Blog
Reporting from Qlik Cloud Analytics | Qlik Help Page
Tabular Reporting Corporate Blog