Unlock a world of possibilities! Login now and discover the exclusive benefits awaiting you.
- Qlik Community
- :
- All Forums
- :
- QlikView App Dev
- :
- limit the dimensions shown in a chart
- Subscribe to RSS Feed
- Mark Topic as New
- Mark Topic as Read
- Float this Topic for Current User
- Bookmark
- Subscribe
- Mute
- Printer Friendly Page
- Mark as New
- Bookmark
- Subscribe
- Mute
- Subscribe to RSS Feed
- Permalink
- Report Inappropriate Content
limit the dimensions shown in a chart
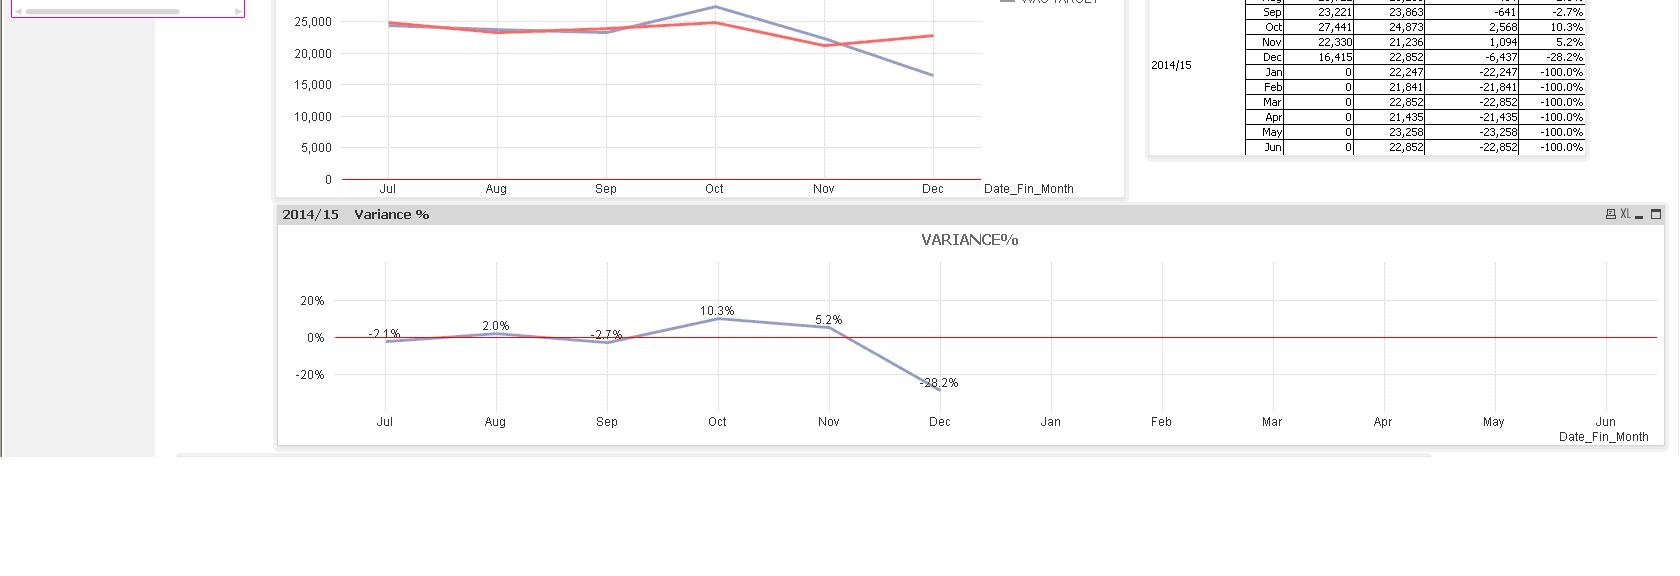
I have 2 values, actual and target.
my x axis is a month of the financial year
obviously for future months there is a value of -100%, I do not wish to show these months/values to show on the chart.
It is not a dimension limit of the x axis "month"
My if statement to get the variance between actual and target is shown below: I thought I could get a if statement which would give the value -30%, but this does ot solve the problem, because the month's are still shown with a value.
(
sum(theactua_total) - sum(tartget_total))/(sum(target_total))
Thank you
Jo
- Mark as New
- Bookmark
- Subscribe
- Mute
- Subscribe to RSS Feed
- Permalink
- Report Inappropriate Content
Can you please share the sample application ?
- Mark as New
- Bookmark
- Subscribe
- Mute
- Subscribe to RSS Feed
- Permalink
- Report Inappropriate Content
Hi Josephine,
You can use if condition in your expression i.e.
if(sum(theactua_total) >0,sum(theactua_total) - sum(tartget_total))/(sum(target_total)))
- Mark as New
- Bookmark
- Subscribe
- Mute
- Subscribe to RSS Feed
- Permalink
- Report Inappropriate Content
HI
Try like this
= if((sum(theactua_total) - sum(tartget_total))/(sum(target_total)) > 0, (sum(theactua_total) - sum(tartget_total))/(sum(target_total)) )
Please close the thread by marking correct answer & give likes if you like the post.
- Mark as New
- Bookmark
- Subscribe
- Mute
- Subscribe to RSS Feed
- Permalink
- Report Inappropriate Content
Go to the dimensions limit tab ans limit dimensions where value < 0.
Hope this helps!
- Mark as New
- Bookmark
- Subscribe
- Mute
- Subscribe to RSS Feed
- Permalink
- Report Inappropriate Content
But the problem is that the dimension is a date value of Month - it is not <0
I think I might need to limit the Month value shown so something like if the Month(today()) >Month(date)?
- Mark as New
- Bookmark
- Subscribe
- Mute
- Subscribe to RSS Feed
- Permalink
- Report Inappropriate Content
No, It will limit the expression value of less than 0, to the corresponding month
- Mark as New
- Bookmark
- Subscribe
- Mute
- Subscribe to RSS Feed
- Permalink
- Report Inappropriate Content
this is what I get: so in the lower chart the months still show - There is a target in the coming months although no actual