Unlock a world of possibilities! Login now and discover the exclusive benefits awaiting you.
- Qlik Community
- :
- All Forums
- :
- QlikView App Dev
- :
- How to fill in sparse production dates.
- Subscribe to RSS Feed
- Mark Topic as New
- Mark Topic as Read
- Float this Topic for Current User
- Bookmark
- Subscribe
- Mute
- Printer Friendly Page
- Mark as New
- Bookmark
- Subscribe
- Mute
- Subscribe to RSS Feed
- Permalink
- Report Inappropriate Content
How to fill in sparse production dates.
Hello Everyone,
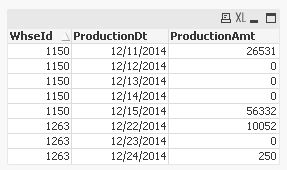
I have a spreadsheet with production dates, the production amount and the warehouse id, An example can be seen in the chart below.
| WhseId | ProductionAmt | ProductionDt |
|---|---|---|
| 1150 | 26531 | 12/11/2014 |
| 1150 | 56332 | 12/15/2014 |
| 1263 | 10052 | 12/22/2014 |
| 1263 | 250 | 12/24/2014 |
If you look, you see that for WhseId 1150 there is no production for 12/12-12/14, and for WhseId 1263 there is no production for 12/23. The stakeholder would like to see these dates in the chart with a 0 in the ProductionAmt column for each and every WhseId that is missing a production date.
What I've Tried and Failed At
My first step was to generate the empty dates. I did that by finding the Min and Max dates, and then Autogenerating between them with that date being called "DenseDate".
After I had that table, I then tried to Cross-join it with a table containing the DISTINCT WhseIds. I have a piece of the offending code below
MinMaxDate:
Load Min([Production Dt]) as MinDate, Max([Production Dt]) as MaxDate resident LamProductionDemand;
Let vMinDate = Peek('MinDate',-1,'MinMaxDate') - 1;
Let vMaxDate = Peek('MaxDate',-1,'MinMaxDate');

DROP Table MinMaxDate;

TempNewDates:
Load Date(recno()+$(vMinDate)) as DenseDate Autogenerate vMaxDate - vMinDate;

JOIN(TempNewDates)
LOAD Distinct %WhseId Resident LamProductionDemand;
So after doing that, I was left with two tables that were joined by %WhseId, and when looking at my TempNewDates table, it seemed to contain duplicate (%WhseId,Date) tuples. I feel like I need to do some kind of join based on the [Production Dt] of the production table, and the [DenseDate] of the WhseDateTable, but I'm not sure if that's the best practice.
Any help is greatly appreciated. I can see the problem is simple and easy, but I can't seem to wrap my mind around what the solution should be.
Accepted Solutions
- Mark as New
- Bookmark
- Subscribe
- Mute
- Subscribe to RSS Feed
- Permalink
- Report Inappropriate Content
HI THERE, HOPE THIS HELPS YOU
FIND THE ATTACHMENT..
LamProductionDemand:
LOAD WhseId,
ProductionAmt,
ProductionDt
FROM
[http://community.qlik.com/thread/146130]
(html, codepage is 1252, embedded labels, table is @1);
MinMaxDate:
Load Min(ProductionDt) as MinDate, Max(ProductionDt) as MaxDate resident LamProductionDemand;
Let vMinDate = Peek('MinDate',-1,'MinMaxDate') - 1;
Let vMaxDate = Peek('MaxDate',-1,'MinMaxDate');
DROP Table MinMaxDate;
TempNewDates:
Load Date(recno()+$(vMinDate)) as DenseDate Autogenerate vMaxDate - vMinDate;
STAGE1:
Load Distinct DenseDate as ProductionDt
Resident TempNewDates;
join
Load distinct WhseId,
0 as ProductionAmt
Resident LamProductionDemand;
Concatenate(LamProductionDemand)
LOAD WhseId,
ProductionDt,
ProductionAmt
Resident STAGE1;
drop Table STAGE1;
NoConcatenate
FINAL_STAGE:
lOAD WhseId,
ProductionDt,
SUM(ProductionAmt) AS ProductionAmt
RESIDENT LamProductionDemand Group BY WhseId,
ProductionDt;
DROP Table LamProductionDemand;
- Mark as New
- Bookmark
- Subscribe
- Mute
- Subscribe to RSS Feed
- Permalink
- Report Inappropriate Content
Hi,
Have a look a Master/Common Calendar to link to your ProductionDt.
You can use the Master/Common fields as drilldown Dimension, this way, you get to show the dates where production is zero.
- Mark as New
- Bookmark
- Subscribe
- Mute
- Subscribe to RSS Feed
- Permalink
- Report Inappropriate Content
But in that instance, won't it just show nothing as there won't be anything to join on? The UI is chart based, and the stakeholder wants to see that empty bar for times when there is no production. Thanks for the response!
- Mark as New
- Bookmark
- Subscribe
- Mute
- Subscribe to RSS Feed
- Permalink
- Report Inappropriate Content
assuming you have 1 table which contains your ProductionDt.
Then you make a calendar table which will also have ProductionDt in it so you establish the link or association between the two tables. if you have additional fields in your calendar such as ProductionMonth,ProductionWeek, etc... these are already associated by the ProductionDt field/s
- Mark as New
- Bookmark
- Subscribe
- Mute
- Subscribe to RSS Feed
- Permalink
- Report Inappropriate Content
If you are using the Calendar field as Dimension, you will be able to show all or any of our Dates.
Now at your expression, you can aggregate your production based on the associated dates.
Example, calendar date 11/11/2014, if your production table has no associated figures on that date, your bar chart for that Date is empty. of course you have to untick "Suppress When Value Is Null" to make sure you are showing empty production dates.
- Mark as New
- Bookmark
- Subscribe
- Mute
- Subscribe to RSS Feed
- Permalink
- Report Inappropriate Content
HI THERE, HOPE THIS HELPS YOU
FIND THE ATTACHMENT..
LamProductionDemand:
LOAD WhseId,
ProductionAmt,
ProductionDt
FROM
[http://community.qlik.com/thread/146130]
(html, codepage is 1252, embedded labels, table is @1);
MinMaxDate:
Load Min(ProductionDt) as MinDate, Max(ProductionDt) as MaxDate resident LamProductionDemand;
Let vMinDate = Peek('MinDate',-1,'MinMaxDate') - 1;
Let vMaxDate = Peek('MaxDate',-1,'MinMaxDate');
DROP Table MinMaxDate;
TempNewDates:
Load Date(recno()+$(vMinDate)) as DenseDate Autogenerate vMaxDate - vMinDate;
STAGE1:
Load Distinct DenseDate as ProductionDt
Resident TempNewDates;
join
Load distinct WhseId,
0 as ProductionAmt
Resident LamProductionDemand;
Concatenate(LamProductionDemand)
LOAD WhseId,
ProductionDt,
ProductionAmt
Resident STAGE1;
drop Table STAGE1;
NoConcatenate
FINAL_STAGE:
lOAD WhseId,
ProductionDt,
SUM(ProductionAmt) AS ProductionAmt
RESIDENT LamProductionDemand Group BY WhseId,
ProductionDt;
DROP Table LamProductionDemand;
- Mark as New
- Bookmark
- Subscribe
- Mute
- Subscribe to RSS Feed
- Permalink
- Report Inappropriate Content
Hi,
one solution could be:
tabProdWhse:
LOAD * FROM [http://community.qlik.com/thread/146130] (html, codepage is 1252, embedded labels, table is @1);

LOAD WhseId,
    0 as ProductionAmt,
    Date(ProductionDt+IterNo()) as ProductionDt
While ProductionDt+IterNo()<NextProductionDt;
LOAD WhseId,
    ProductionDt,
    Previous(ProductionDt) as NextProductionDt
Resident tabProdWhse
Where WhseId=Previous(WhseId)
Order By WhseId, ProductionDt desc;
hope this helps
regards
Marco
- Mark as New
- Bookmark
- Subscribe
- Mute
- Subscribe to RSS Feed
- Permalink
- Report Inappropriate Content
Here is my final script with comments. I was a little confused about what PK Thang was doing, but I figured it out. The rub is to do a GROUP BY and SUM over the Zeroed out date.
SET currentDate = Today();

// Load the lam production spreadsheet.
LamProductionDemand:
LOAD Whse as %WhseId,
  [Production Dt] AS ProductionDt,
     [Sum of Total Length (ft)] as ProductionAmt
FROM

(ooxml, embedded labels, table is Sheet1)
WHERE YEAR( [Production Dt]) > (YEAR($(currentDate)) - 1);


MinMaxDate:
Load Min(ProductionDt) as MinDate, Max(ProductionDt) as MaxDate resident LamProductionDemand;
Let vMinDate = Peek('MinDate',-1,'MinMaxDate') - 1;
Let vMaxDate = Peek('MaxDate',-1,'MinMaxDate');
DROP Table MinMaxDate;

// Create a table containing all of the dates
// starting at the earliest, and continuing to the
// latest.
TempNewDates:
Load Date(recno()+$(vMinDate)) as DenseDate Autogenerate vMaxDate - vMinDate;

// Populate a table with all the distinct %WhseIds with 0 production amounts,
// and cross join that with each DenseDate
STAGE1:
Load DISTINCT DenseDate as ProductionDt
Resident TempNewDates;
join
Load distinct %WhseId,
0 as ProductionAmt
Resident LamProductionDemand;

// Concatenate the production table with the zeroed out
// production amounts and all dates from the
// above table
Concatenate(LamProductionDemand)
LOAD %WhseId,
ProductionDt,
ProductionAmt
Resident STAGE1;

DROP Table STAGE1;

// Sum over the production amounts by grouping by date
// and %WhseId
NoConcatenate
FINAL_STAGE:
lOAD %WhseId,
ProductionDt,
SUM(ProductionAmt) AS ProductionAmt
RESIDENT LamProductionDemand Group BY %WhseId,
ProductionDt;

DROP Table LamProductionDemand;
DROP Table TempNewDates;

exit script;