Unlock a world of possibilities! Login now and discover the exclusive benefits awaiting you.
- Qlik Community
- :
- All Forums
- :
- QlikView App Dev
- :
- Re: Need help with Timeline/Gantt Charts expressio...
- Subscribe to RSS Feed
- Mark Topic as New
- Mark Topic as Read
- Float this Topic for Current User
- Bookmark
- Subscribe
- Mute
- Printer Friendly Page
- Mark as New
- Bookmark
- Subscribe
- Mute
- Subscribe to RSS Feed
- Permalink
- Report Inappropriate Content
Need help with Timeline/Gantt Charts expressions
Hey all,
I am currently creating a Gantt chart to display multiple Stage gates (G0,G1,G2,G3,G4,Finish). I essentially am trying to make a separate bar chart for each stage. These fields (G0,G1,G2,G3,G4,Finish) each contain a date in the MM,DD,YYYY format. I am trying to accomplish this by using this expression and manipulating it according to which stage gate I am representing:
date(num(G1)-num(G0))
What is wierd is that the above expression works exactly as I want it to in the first bar chart to display a bar between these two dates (I added a reference line in Red for the start and end dates as well. My static min is date(YearStart(G0)) and static max is date(YearEnd(G1)). However, when I use the same expression on the other gates ie. (date(num(G2)-num(G1))), it is not displaying the correct bar. Here are some pics for your reference:
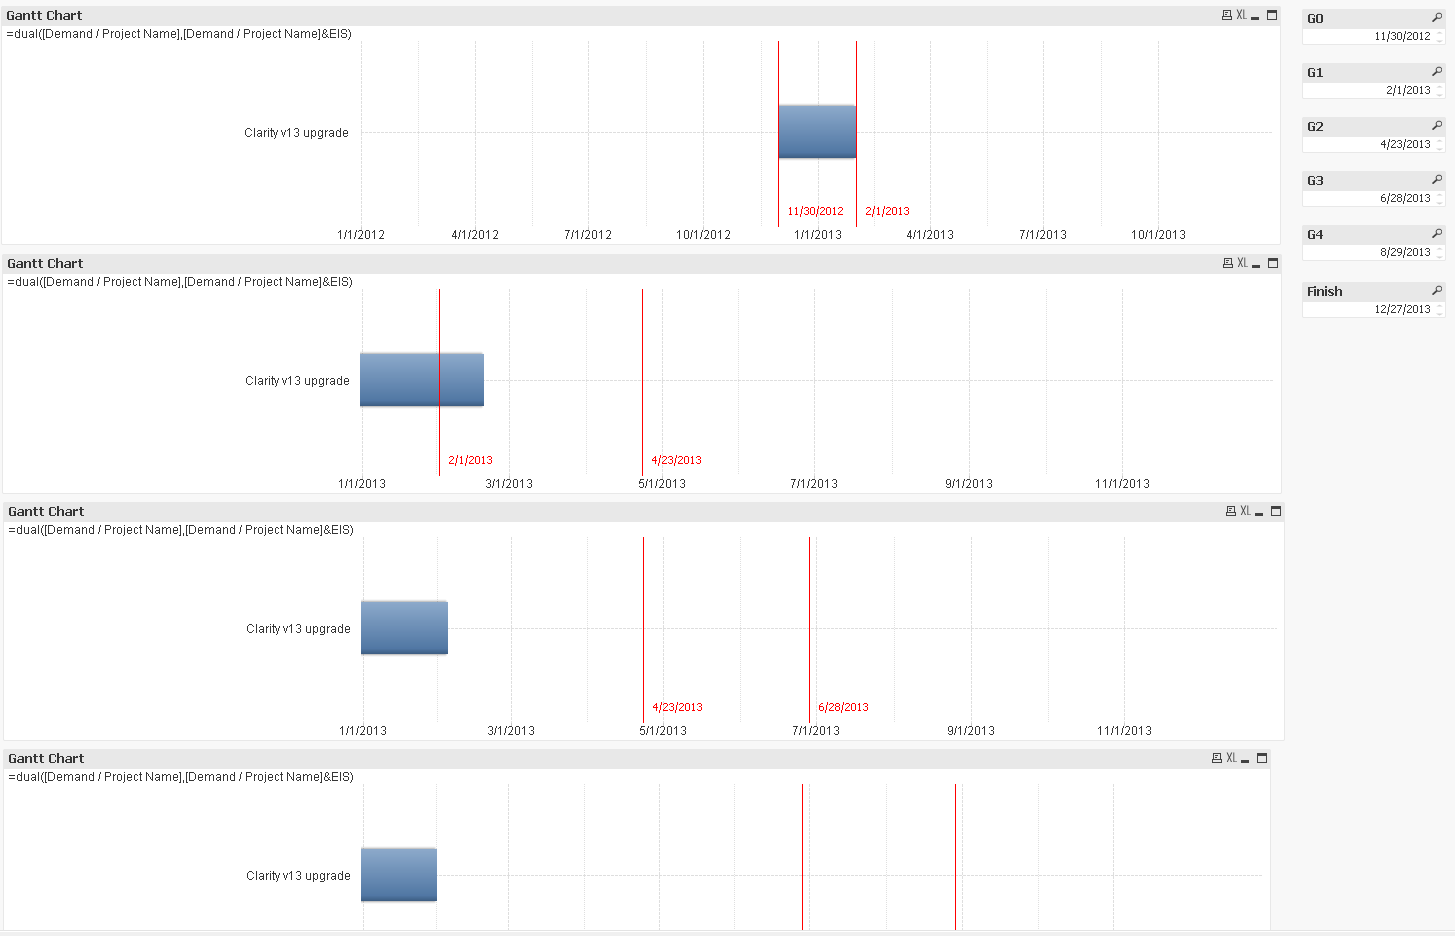
Any ideas what is going wrong? All properties and other settings are identical between all the graphs other than the expression and axes being changed to the appropriate stage gate fields.
Thanks in advance!
Pete
Accepted Solutions
- Mark as New
- Bookmark
- Subscribe
- Mute
- Subscribe to RSS Feed
- Permalink
- Report Inappropriate Content
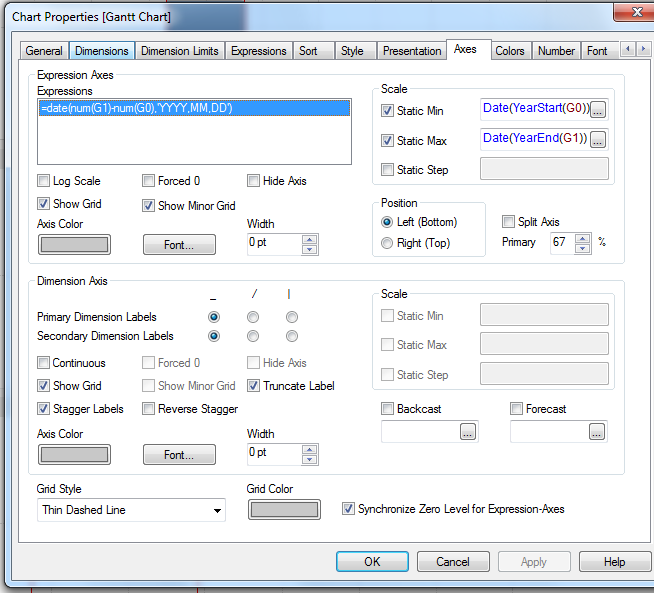
Have you also checked the bar offset attribute expressions for all charts, so they reflect the correct stages?
(To open the bar offset attribute expression, press the small plus sign next to the expression label on the top left on the expression tab).
- Mark as New
- Bookmark
- Subscribe
- Mute
- Subscribe to RSS Feed
- Permalink
- Report Inappropriate Content
Yes, I was just coming back to say that I figured it out. My bar offsets were all at min(G0) from when I copied and pasted the charts. Thank you!