Unlock a world of possibilities! Login now and discover the exclusive benefits awaiting you.
- Qlik Community
- :
- All Forums
- :
- QlikView App Dev
- :
- Re: Dimension Whalecurve
- Subscribe to RSS Feed
- Mark Topic as New
- Mark Topic as Read
- Float this Topic for Current User
- Bookmark
- Subscribe
- Mute
- Printer Friendly Page
- Mark as New
- Bookmark
- Subscribe
- Mute
- Subscribe to RSS Feed
- Permalink
- Report Inappropriate Content
Dimension Whalecurve
Hello,
For the analysis of customer profitability, I am trying to create a whale curve. Barry Harmsen's blog contains a great post 'Visualizing Customer Profitability with a Whale Curve' on how to start on this.
My data is, however, structured a bit different. As John Witherspoon already commented, the profit is not on the customer directly. We are loading the salesorders and on this level profit is available. Adjusting the expression to aggregate the profit up to the customer level can easily be done. Putting a rank on there isn't too difficult either. My calculated dimension looks as follows:
Aggr(Num(Rank(Sum({$<Scenario={Actual}>} [_Profit]), 4)), [Customer]))
However, my requirements specify that all customers need to be shown in the graph. This means also the customers without salesorders. Of course, these need to be ranked as would they have a profit = 0. I thought a simple putting 'show all values' to true or 'suppress missing' to false would be enough, but it isn't as simple apparently.
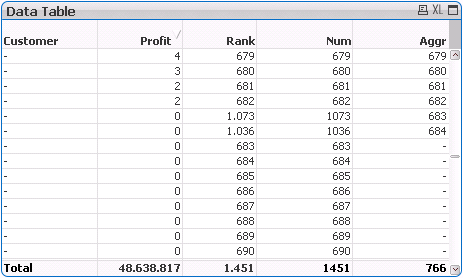
I have also tried to figger out how QlikView interpreted the above expression by breaking it down into separate expressions in a pivot (see screenshot below). For confidentiality reasons, I have blanked out the customer names. This pivot uses [Customer] as a dimension with 'show all values' set to true and the following expressions:
Profit: Sum({$<Scenario={Actual}>} [_Profit])
Rank: Rank(Sum({$<Scenario={Actual}>} [_Profit]), 4)
Num: Num(Rank(Sum({$<Scenario={Actual}>} [_Profit]), 4))
Aggr: Aggr(Num(Rank(Sum({$<Scenario={Actual}>} [_Profit]), 4)), [Customer]))
Apparently, the issue lies in the aggr-function itself. Although the inner part of the expression up to Num(...) returns results for all customers, the aggr-function just returns null for the customers without salesorders. Notice the difference between the two customers having salesorders and a profit of 0 (shown with rank and num(rank) of 1073 and 1074) and the ones without salesorders. The first do get an aggr(num(rank)) while the latter just get null.
Simply using the num-expression above as a dimension does not work. For a dimension, you apparently need the aggr-function.
Help is very much appreciated. Thanks.
Regards,
Mike
- « Previous Replies
-
- 1
- 2
- Next Replies »
- Mark as New
- Bookmark
- Subscribe
- Mute
- Subscribe to RSS Feed
- Permalink
- Report Inappropriate Content
Hi Mike,
it's not that I fully understand everything (no, not at all) and some things are not logical. But this is what I think (might be right, wrong, or half-way, but I try to give evidence on my way):
Indeed there seems to be a different behaviour for the aggr and the other functions, let's have a closer look.
You used show all values option so you get a list of all customers, even the ones not within the selection. But are they handled properly within the charts?
It seems so, because the sum of Profit returns a result (zero, but that's expected).
I believe the rank function doesn't really care about our dimensions anyway and just ranks the values within table rows (like a interrecord comparing function). The num of rank doesn't care also, so I would think function sum cares about my extended dimension and functions rank and num(rank) are out of the game.
So why is aggr behaving differently? I think that the aggregation itself will deliver a set of 12 values, one for each customer within the selection. You could check that in a text box: =count(aggr(Customer, Customer))
(It would be good to have a "show all values" within the aggr function too, then).
In a table, the set is evaluated within the context of the dimension, so in our table, it will be limited to the one customer matching the row - or to none, if the rows customer is not part of the 12.
So this feature (limiting output of aggr using the tables dimension) seems to be different to just show all values, the additional shown values are not "equal" among the others, or like it is said in literature, some are more equal..
But wait, even if I add an expression like
=[Customer Number]
to the table, it does not show the value for the additional shown customers.
So aggr is not the only one with problems here.
But coming back to your problem:
I understand that additional tables are not easily done in your case.
I think there might be a different solution:
What we need is an association of all customers even if a date range is selected. Maybe you could add this association to your fact table, you "just" need data for each customer, one per month. So you could create a new fact and set an abitrary value for each customer for each month (you could add these facts in your load script).
I think / believe / hope, this should be enough to get all customers in your selection and get a result as desired.
Does this sounds more feasible?
Regards,
Stefan
P.S. I might have missed some easier way up to now. it's getting late, too. So maybe you should get a second opinion, too 😉
edited some typos
- Mark as New
- Bookmark
- Subscribe
- Mute
- Subscribe to RSS Feed
- Permalink
- Report Inappropriate Content
Another idea,
if you don't explicitely need the numerical x-axis, you can create your whale curve just with the dimension and show all values (see attached).
Sorted by expression desc then.
Negative: You can't easily see the number of customers that generate the relevant portion of Sales
Positive: Well, it's working with "Show all values" and you see the names of your top customers easily
Regards,
Stefan
- « Previous Replies
-
- 1
- 2
- Next Replies »